|
Practical, Hands-on Workshop
|
|
|
|
Cutting Edge Techniques to Convert Data into Actionable
Information using Microsoft Excel |
|
You Will Learn:
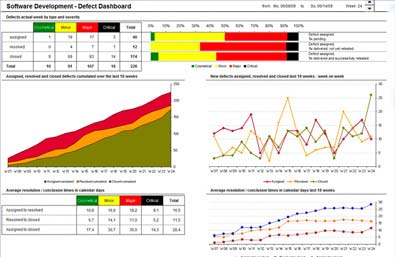
- How to Build Stunning Dashboards in Excel
- Use Advanced Excel Functions & Formulas
- Powerful Pivot Table Techniques to Analyze Data
- Present Insights with Thermometer & Pareto Charts
- Use Macros for Updating Dashboards Automatically
- Exploit Advanced Features in Microsoft Excel 2010
- Creating Dynamic Dashboards to Portray KPIs
|
 |
|
| When: |
27 February 2014, in Bahrain |
| Time: |
9am - 5pm |
| Target Audience: |
Business Analysts from Sales, Marketing, Finance, IT, Project Managers, Directors, CXOs. |
| Venue: |
Hotel in Central Bahrain |
|
|
|
|
|
| |