Infographics & Data Visualization With Excel

WSQ, UTAP & SkillsFuture Grants in Singapore at Intellisoft

The Best Advanced Excel Course To Upgrade Your Skills

Excel Infographics Course

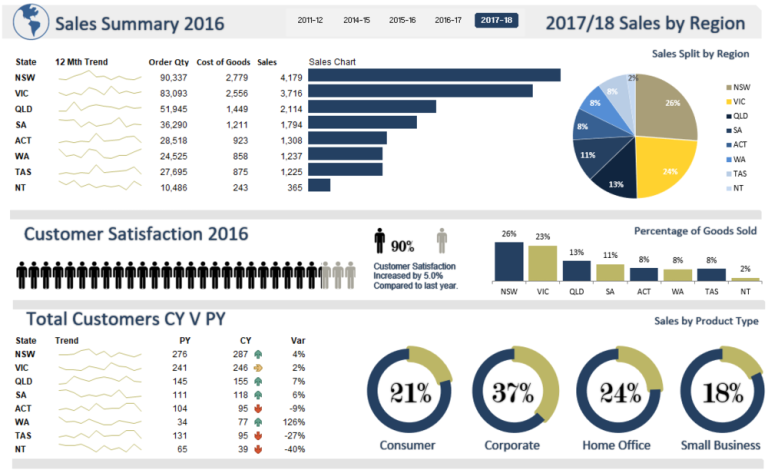
The Infographics and Data Visualization With Excel Course is a high-level Excel certification program which will enhance your skills to another level.

Upon completion, you will master how to analyze and visualize information quickly by using the more advanced formulas, functions and hidden features of Excel. 

You will be able to produce reports with infographics and perform data analysis easily, saving time & improving productivity.

We focus on teaching you how to use the Advanced features of Excel:

  • Best Practices of Infographics Design,
  • How to Load & Clean Data,
  • Use Pivot Tables,
  • Advanced Filtering,
  • Functions like VLOOKUP,
  • Tips for Data Analysis, 
  • Crafting a Story based on the Data,
  • and much more…

We also provide you with a dedicated Laptop for use in our Excel Infographics and Data Analysis Workshop, so you can learn the Advanced Excel functions and features quickly in class in Singapore.

We will have the latest Excel 365 software preloaded, along with the exercises for practice in the class. The whole training program is very practical and hands-on.

Use WSQ, SFEC, UTAP, PSEA Grants to enhance your skills in Advanced Excel techniques.

Learn Advanced Features of Excel To Analyze & Visualize Data

In Just 3 Days,

Master Pivot Tables, Vlookup, Macros To Create a Data Story
With Infographics & Data Visualizations

This training will give you opportunities to practice with real world scenarios.
Master Microsoft Excel Easily, Today!

Data Visualization & Infographics With Excel: Course Objectives

After Completing the Infographics & Data Visualisation With Excel Course, Participants will be able to:

  • Design and Produce Compelling Visualizations, Infographics andLaptop with Excel Window Report for Clients & Management,
  • Apply Advanced Excel Techniques to Clean data using Excel,
  • Use Excel Formulas & Functions to Process the data & Perform Lookups,
  • How to Analyze Data with Excel Tools like Pivot Tables, Slicers,
  • How to Visualize data using Excel Tools like Charts & Maps,
  • Design & Create infographics, and
  • Learn Different Ways to execute visual data storytelling

They will learn to deploy Advanced Excel features to increase productivity and improve efficiency by streamlining the workflow.

Participants will learn to use advanced features and functions of Office 365  to improve productivity, improve data storytelling through the use of infographics and data visualizations, and process data with Pivot Tables, Macros, Charts, Functions & Formulas quickly.

                See the Detailed Course Outline below

Infographics Course in Excel at Intellisoft Training

Now With WSQ, SFEC, SkillsFuture & UTAP Funding!

Need a Course Brochure?
We'll send you one!

Infographics, Data Analysis & Data Visualization Training in Excel

Microsoft Excel is the most effective and popular software for data analysis & data visualization.

This course covers the most valuable topics of Data Analysis, Data Storytelling, Using Visuals & Infographics. Virtually all companies need their key people to have practical Data Visualization & Analysis skills with Excel.

Advanced Excel Tips & Tricks in 3 days

On completion of Infographics & Data Visualization Certification Training, you will be able to:

  • Advanced Excel Techniques to Clean data using Excel,
  • Apply Formulas & Functions to Process the data & Perform Lookups,
  • How to Analyze Data with Excel Tools like Pivot Tables, Slicers,
  • How to Visualize data using Excel Tools like Charts & Maps,
  • Design & Create infographics, and
  • Different Ways to execute visual data storytelling

Course Outline

Infographics & Data Visualization With Advanced Excel Techniques

SECTION A: Process and Clean Data

Lesson 1: Introduction to Infographics Design and Data Visualization

  • Tools available to design & produce visualizations,
  • Tools for designing infographics
  • Data Reporting Tools & Techniques


Lesson 2: Advanced Excel Techniques to Clean data using Excel

  • Sorting & Filtering
  • Functions & Formulas
  • Conditional Formatting
  • Remove Duplicates
  • Macros to Clean Data


Lesson 3: Data Processing & Data Lookups

  • Data Validation With Lists etc
  • Tables
  • Lookup Functions
  • Consolidate from Multiple Sheets


SECTION B:  Data Analysis and Data Visualization

Lesson 4: Data Analysis & Data Visualization

  • Introduction to Pivot Tables
  • Data analysis With Pivot Tables
  • Using Slicers
  • Pivot Charts


Lesson 5: Using Statistical Functions in Data Analysis

  • Using Summary Functions,
  • Introduction To Statistical Functions
  • Statistical Analysis With Excel


Lesson 6: Visualization With Excel Charts

  • Creating Different Chart Types
  • Using Maps Charts
  • Creating Combo Charts
  • Analysis With Histograms


SECTION C:  Data Storytelling

Lesson 7: Creation of Infographics

  • Design & Create infographics, and
  • Infographic Design
  • Standards & Best Practices


Lesson 8: Visual Data Story Telling

  • Different Ways to execute visual data storytelling
  • Create a complete, compelling Story with Infographics & Visualizations

Now With WSQ, SFEC, SkillsFuture & UTAP Funding!

WSQ, UTAP & SkillsFuture Grants in Singapore at Intellisoft

Target Audience

Course Duration:  3 Days full days (Weekdays or Weekends)

Course Timings: 8.45 am – 5.45 pm

Target Audience: Suitable to All Users who have Basic Knowledge of Excel. 

This program is most suitable for you if you use Microsoft Excel in your day-to-day work, and know the basics of Excel pretty well. You must be keen to extend your knowledge of the more advanced features & functions of Excel to become more productive and make the most of Microsoft Excel Office 365 to analyze and visualize data.

If you would like to learn How to write VLOOKUP in Excel, How to Summarize Data using Pivot Tables, or How to Use the Infographics or Data Visualization Tools in Excel, then this Advanced Excel course on Infographics and data visualization is best suited for you.

Join The Best WSQ Advanced Excel Course in Singapore

Certification: Successful trainees will receive the internationally recognized SSG Certificate of Attainment upon completion of the course & assessment. This certificate is administered by SSG Singapore.

Students must pass the assessment at the end of the course to qualify for the WSQ Grant & Certificate.

Best Laptop For ExcelPrerequisites

  • Knowledge and Skills
    • Able to operate computer functions with minimum Computer Literacy Level 2 based on ICAS Computer Skills Assessment Framework
    • Minimum 3 GCE ‘O’ Levels Passes including English or WPL Level 5 (Average of Reading, Listening, Speaking & Writing Scores)
  •  Experience
    • Minimum of 1 year of working experience, and Minimum 18 years old 

The learners must have basic proficiency in reading, writing, and understanding English.

  • We look for participants with at least O Level education as a pre-requisite
  • Ideally, Participants should have completed the Basic Excel Training  and should know  things like basic formatting, copying cells, opening Excel Files, moving, renaming sheets, and writing simple formulas to do basic arithmetic.

What Our Happy Participants Say

Training Course Fees

The full course fees for this training is S$750, before any Government funding.
For Singaporean/PR above 21 years, Training Grants are available.
For Foreigners, no government grants are available.

Grant Information

WSQ funding from SkillsFuture Singapore (SSG) is available to Singaporeans/PRs above 21.
(Both Individuals & Company Sponsored ).

Individual Singaporeans, 25 years & above can also use their SkillsFuture Credits for this training at Intellisoft.

Companies sending Locals & Foreign staff for training can avail SFEC Funding. 
Use it to improve the skills of your entire department!

NTUC Members can utilize UTAP Funds to offset 50% of the remaining fees*.

Contact us for more information on How to apply for this SkillsFuture Grant.
Call +65-6252-5033 for Details or WhatsApp Now at +65-9066-9991

70% Grant

$525 Funding by SSG
Pay $225
  • Singaporeans Above 40 Years
  • Individuals
  • SME Companies
  • Individuals Can Use SkillsFuture
  • UTAP Funding*

50% Grant

$375 Funding by SSG
Pay $375
  • Below 40 Years
  • Individuals
  • SG / PR / MNC Companies
  • SkillsFuture (Singaporeans only)
  • UTAP Funding*

Do You Have Any Questions

on Course Fee, WSQ Grant or Funding?

Ask Us. We’ll be happy to assist you.
Save time using Excel

Course Dates

data visualization course in Singapore

Now With WSQ, SFEC, SkillsFuture & UTAP Funding!

Learn With Intellisoft & Boost Your Career

Intellisoft Training at Central Singapore

How to Register for Infographics & Data Visualization With Excel Training

Simply fill this Online Registration Form to book your seat.
Our Training Officer will get in touch with you to confirm your seat shortly.

You can call at at +65 6252-5033 or 9066-9991 (Whatsapp now) if you have any questions.
Register Now

Get in Touch

Intellisoft Training Pte Ltd

190 Middle Road, #10-08 Fortune Centre,
Singapore 188979

(65) 6252-5033 (Call)

(65) 9066-9991 (Whatsapp now)

Free Webinar on
Advanced Excel
Formulas & Shortcuts
(1hour)

Signup Now & Learn Advanced Formulas & Shortcuts For Free

Start Saving Today

Get the 8 Tips to Start Saving on Your Website Design
PDF Guide emailed to you now.

Save Money on Website Design Guide