What are Infographics?
As you scroll into your Facebook, Instagram, Google or look around you, what infographics do you notice? Today, I’ll be sharing with you all about infographics & what it’s impact in your marketing strategies.
Have you seen the latest Covid-19 graphic announcement all in one sheet?
Did you know about the latest sale from Lazada, Shopee & other online stores?
Have you noticed the latest print ad of the new collection from your favorite restaurant?
If these details are written in multiple pages, would you read it all?
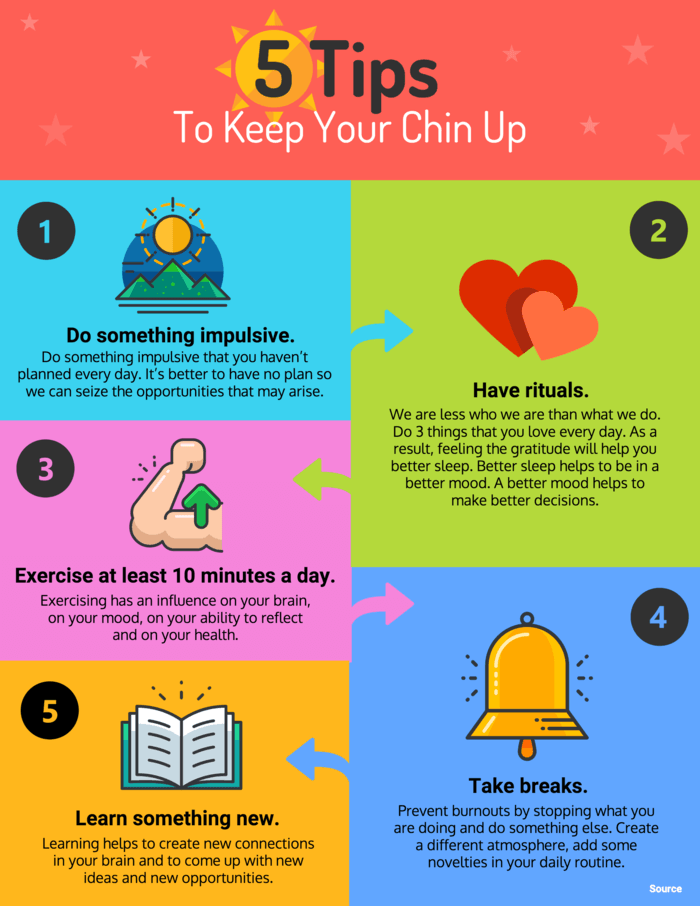
A one-page image & text present all you need to know from a 500+ word scope.
These visual elements with written words are called infographics. Infographics has paved way into dissemination of announcement & information on the Gen Z era.
As digitalization has been the way to have more connection essential for relevant information, brand engagements, traffics and overall digital performance is through infographics.
What are the Benefits of Infographics?
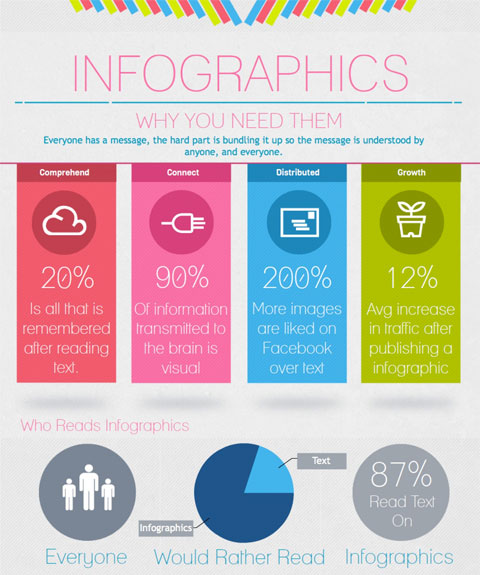
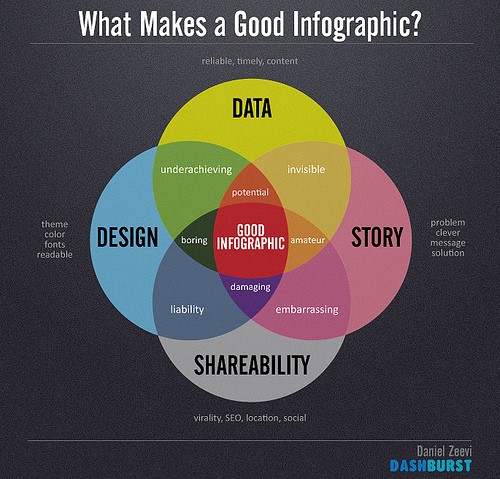
Infographics are more attractive
Colors, Pictures & Slogans combined creates attraction to the eyes that makes anyone stop walking, pause a video, take a break from swiping & take a second to look —that’s when you know you have an effective infographic.
Infographics are more attention-catching
An individual has a short attention span, that gets shorter and shorter as time pass by. Instead of skimming, people to just scan to what they see as opposed to reading the whole thing. Infographics helps to “buy time” from the reader to stay a bit longer and receive the message you need to relay.
Infographics are extremely shareable
Ask yourself, what is the ratio that you open a linked shared as opposed to an image shared? Almost every time, right? Infographics are easy to save on any devices & are easier to share among any platform, email, WhatsApp, Instagram DM & Stories, Facebook posts & more.
Infographics increase promotion
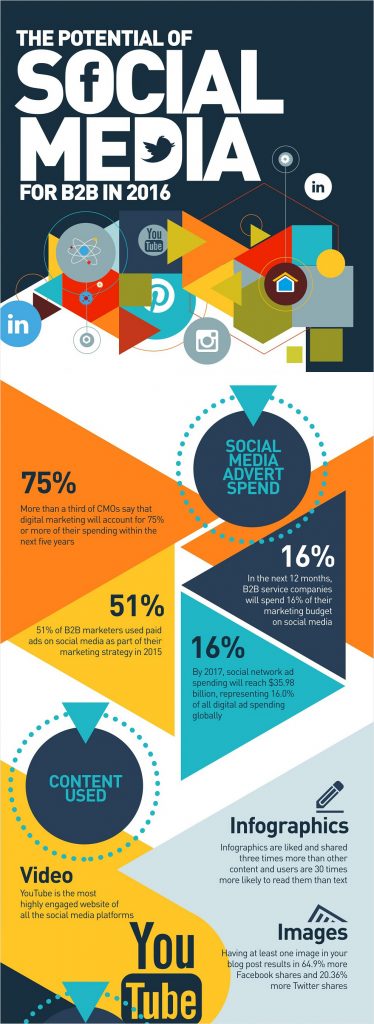
You can put more information in one image. It’s like living as a minimalist. Instead of creating a 1000+ word article or a paragraph form listing, you can use infographics to have in half of your agenda & support it in less that 500 words.
Infographics enhance SEO
A pleasing infographic has been proven to strengthen your SEO. Remember, SEO scores rise in every “Share” and “Click”. With each infographic linked to your website, it would create more traffic to reach on your website, improving your Google Page Rank in the process.
Infographics provide influential & cheap advertisement
You heard it right. Promotions, New Launches and Upcoming events will be more “saleable” if you include useful and meaningful infographics for your audience.
How to Create an Infographics?
Infographics can sound intimidating especially if you are not savvy in this technical jargon used today. But don’t let it stop you. Making one is easier that you may imagine.
Infographics creates visual appeal for your target audience. Visuals plays a vital role in generating impact that can increase users’ engagement to your branding. One of the most effective tools that are widely used by startup businesses, giant companies, government agencies and even bloggers are infographics.
Do’s & Don’ts in Making Your Very First Infographics
- Balance: Text & Virtual
We aim for attraction, not chaos in the eyes. Infographics simply means information on graphics. Too much text will look like an article in one page & too much image may eat up the space for you to express your message. Don’t get too excited. Keep these elements balanced.
- Color scheme
Happy colors attract the eyes. Incorporate colors from the rainbow, ROYGBIV. But do take more that 2-3 colors in one infographic.
- Visual Hierarchy & sizing Elements
The size & the levels of your elements should be from top to bottom based on importance. The most important part of your infographic should be the biggest, brightest & the first area where the viewers pin their eyes more. Then it goes on, making the next important information smaller maintaining the overall balance of your infographic.
- Infographic size
Size matter. You must know where you will put it. You do not want your infographic to display well in your website but appears cropped on your Facebook or Instagram posts.
- Image Quality
No one stays for. Like the sizing, you must now the resolution of where you’ll be placing your infographic. This also applies when you want to print it. You do not want you hard work to printed not in its pristine resolution.
- Icons – must be same style
Icons must also be in one scheme. Avoid using contradicting icon styles that can clash with the balance of your other elements in the infographics.
- Fonts & Colors
Stick to the 2-3 font type & color rule. This avoids “too much noise” in your infographics. Remember, we want the main information to be noticed.
- Margins and Spacing
Nothing beats a well margined & spaced-out elements in an infographic, you do not want it to be a mosaic making viewers’ head tilt from side by side.
What Software to Use in Making Your First Infographics?
Adobe Photoshop is one of the widely used and one of the best available software to create your first infographics.
Photoshop is a powerful tool. Throughout the years it has been a great pillar of image editing used for mostly on printing purposes in almost all industries. And today, it is used to power the creative minds of artists and individuals in creating their infographics online.
Some of the photoshop tricks you can do in your texts are Creating Bullets, Gradient Text, Change the Letter Spacing in Photoshop and more…
Another software to use is the Adobe Illustrator, great for vector based graphics creation.
How to Create Bullets in Photoshop?
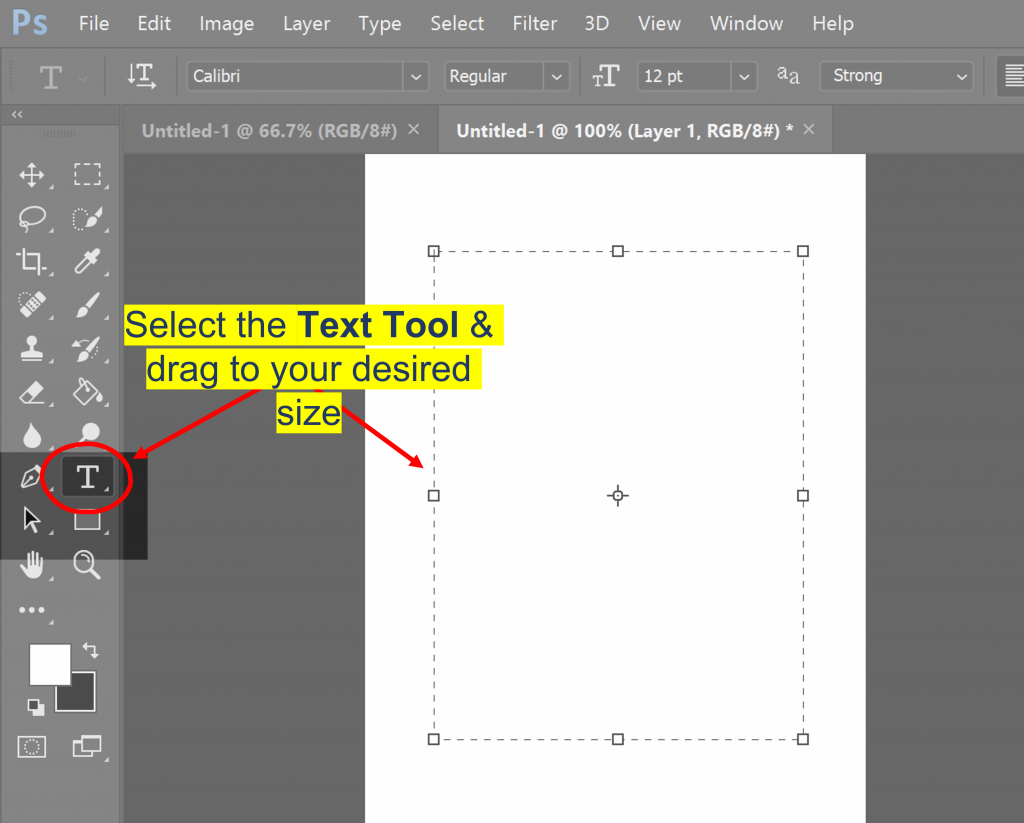
Step 1. Select the Text Tool & drag it to your workspace.
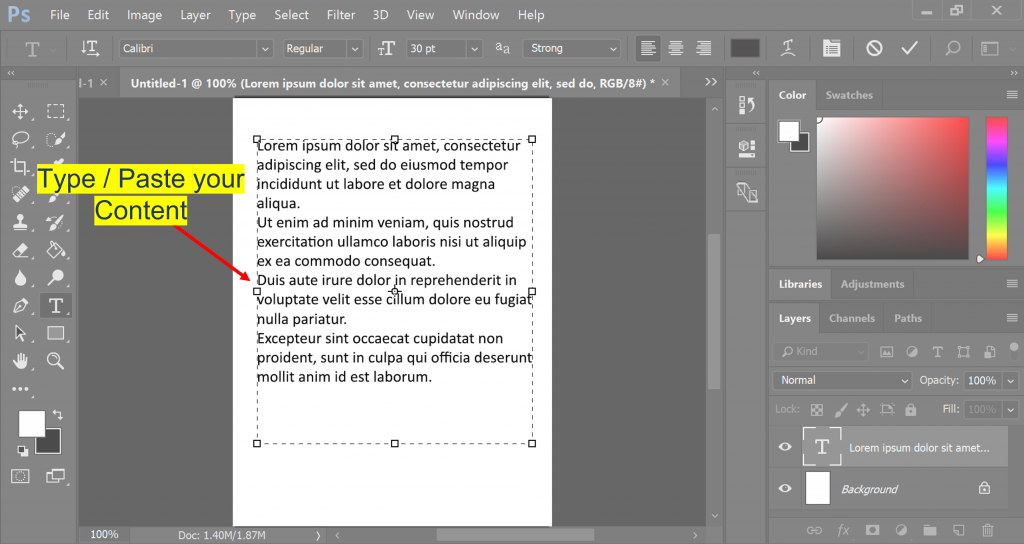
Step 2. Type or Paste your desired content.
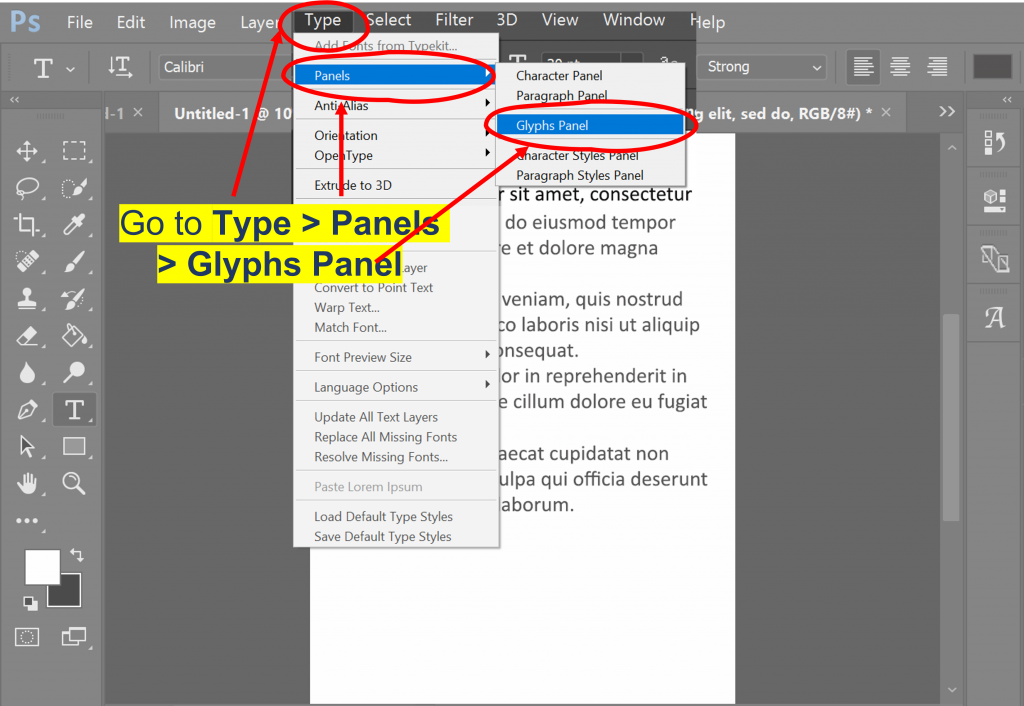
Step 3. With the Text Layer selected, click Type panel on the Photoshop Menu Bar. Hover to Panels then select Glyphs Panel. The Panel Menu will show.
Step 4. Scroll down to the different symbols and sign until you find your desired bullet size.
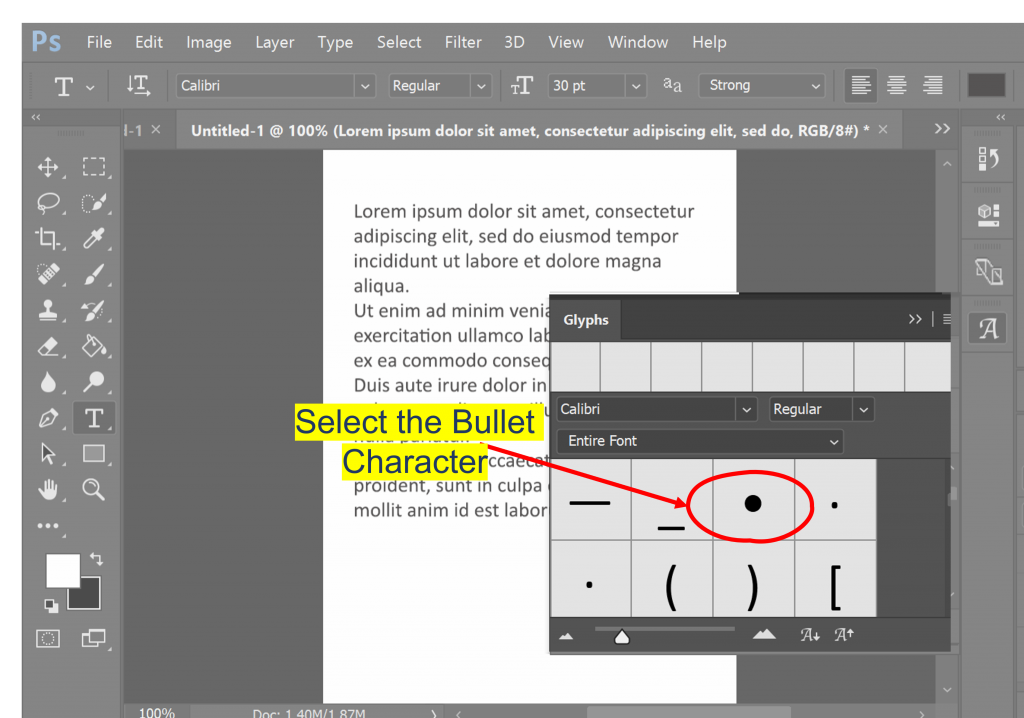
Step 5. Click on the bullet & it will show on the text box.
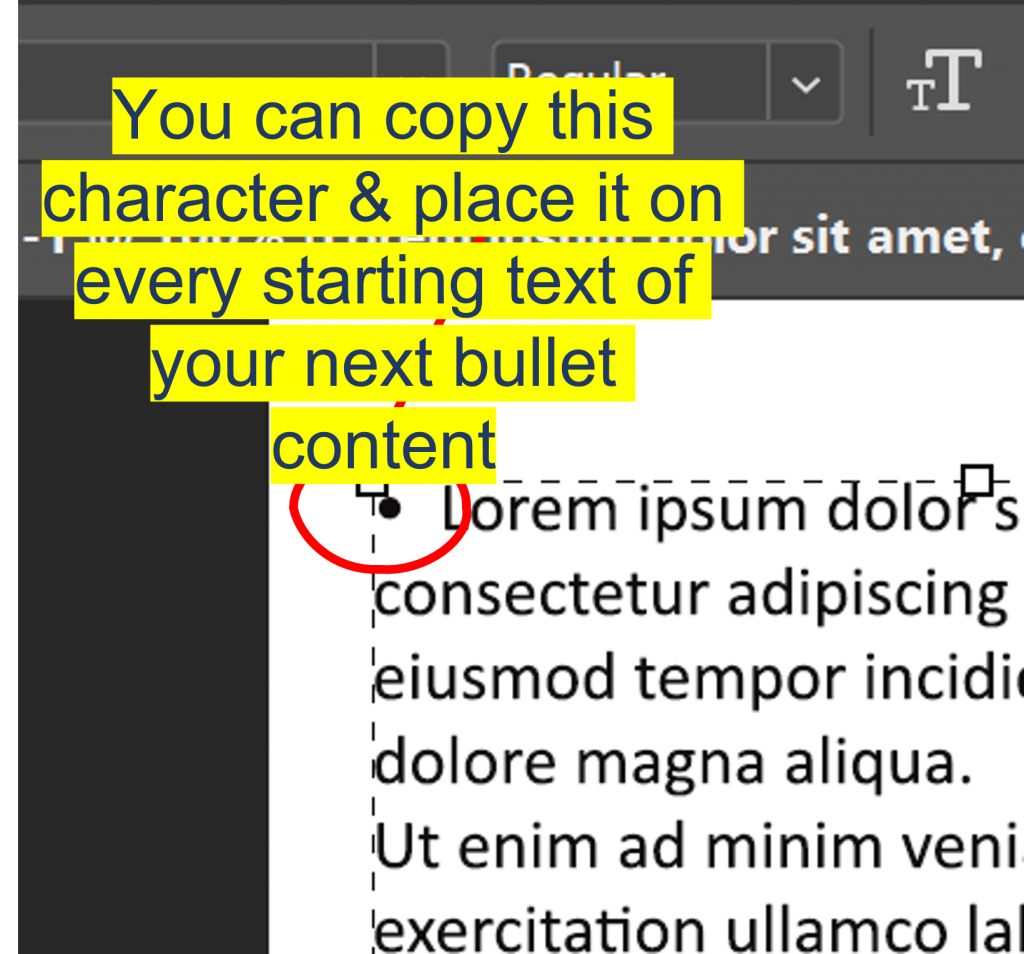
Step 6. If you want to have another bullet, click Enter to proceed to the next line & select the desired bullet size from the Glyphs Panel.
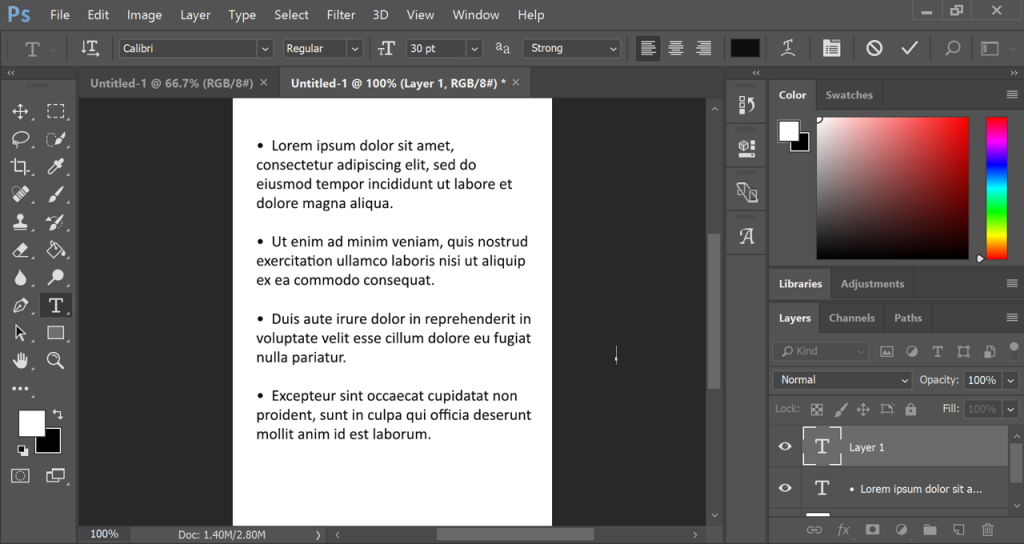
Step6. Repeat steps 4 & 5 until needed. Viola, your bullet list is done!
Learn the Essential Skills in Using Adobe Photoshop in just 3 Days at Intellisoft Singapore!
With Photoshop you can create not just infographics but also manipulate images, invitations, business cards and even website banners.
You can learn how to Create Show Stopper Website Banners with Photoshop as well. If this sparks your interest in learning the amazing Adobe Photoshop, call me at 63924590 to get started!
Cheers!
